Skip to content

Latest commit


History

History
95 lines (68 loc) · 4.39 KB

README.md

File metadata and controls

95 lines (68 loc) · 4.39 KB

Confidence Interval (CI)


CI for z dist.

CI for t dist.

Sample vs Population

P-value on Normal Distribution

Confusion Matrix for Hypothesis Testing

Example for Confusion Matrix of AB Testing

z test score

t test score

z table (for alpha)

Usage of z table

t table (for alpha)

Usage of t table

Alpha (Type I Error), Beta (Type II Error) and Power

What is Power ?

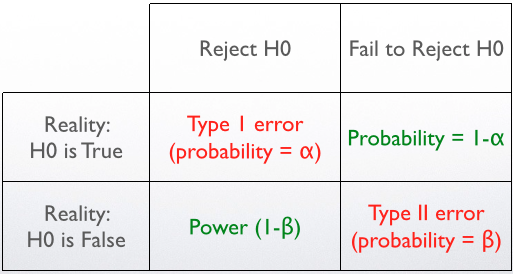
  • Probabilty of receting H0 when it is false
  • 80% power means you have an 80% chance of getting a significant results when results when the effect is real
  • Power tells you how likely you are to detect a real effect
  • 80% power means you'll miss a real effect...
    • 20% of the time
  • Want to find an initial effect and a replication given 80% power?
    • You will only find 64% of the time

Effect Size (ES) for Power Calculation

Effect Size (ES) Relationship with Power

Two-tailed, Left-tailed, Right Tailed Hypothesis Testing

A/B Testing

Two-sample z test for Difference Between Means

Example in Signal Detection with Diffrent Explanation

Hit, Miss, False Alarm, Correct Rejection and ROC Curve