How to obtain the correct corr dim for Lorenz attractor. #14
Comments
|
So far I managed to obtain: from hundun.exploration import calc_dimension_correlation, calc_dimension_information, calc_dimension_capacity
from hundun.equations import Lorenz
u_seq = Lorenz.get_u_seq(20000)
D_0 = calc_dimension_capacity(u_seq, depsilon=0.02, base=7, loop=250, min_correlation=0.999, scale_down=True, batch_ave=10, plot=True, path_save_plot='./capacity.png')
print('D_0=',D_0) # capacity dimension
D_1 = calc_dimension_information(u_seq, depsilon=0.02, base=7, loop=250, min_correlation=0.999, scale_down=True, batch_ave=10, plot=True, path_save_plot='./information.png')
print('D_1=',D_1) # information dimension
D_2 = calc_dimension_correlation(u_seq, depsilon=0.02, base=7, loop=250, min_correlation=0.999, scale_down=True, batch_ave=10, plot=True, path_save_plot='./correlation.png')
print('D_2=',D_2) # correlation dimensionD_0= 1.9669881090760062
D_1= 1.9044696394480827
D_2= 2.0757415161772044Questions: Thanks for your time, |
|
Thank you for opening this issue! Is the value of 20000 the final time or the number of steps?This library treats equations as a class called So, here the 20000 refers to the number of steps. The function How do we know the time series is long enough?Each function has certain evaluation criteria. For example, in
Detailed certain evaluation criteria on wiki 45. How can we know that the value we obtain is realistic when I have no reference value?This is a very difficult question 😔 Personally, I believe that for unknown time series, it is good to check the graph and certain evaluation criteria their appropriateness. It is very difficult to establish appropriate batch sizes, thresholds, etc. for time series. I currently have no ideas other than empirical judgments, but if you have any ideas, please share them with us. About OthersTo obtain better results, the data sampling interval is crucial 6. If the sampling interval is too short, it will not sufficiently cover the entire attractor. If you have any more questions, please feel free to ask 👋 Footnotes
|
|
Thanks for taking the time to respond. I will run more tests and try to digest your suggestions! |
Hi,
I'd like to extend my gratitude for developing such a library. I've chosen to raise a topic in the issues section, anticipating that others may also find it relevant. I aim to utilize your package to calculate the correlation dimension of various dynamical systems. However, to have confidence in the outcomes, I need to be able to replicate the commonly referenced dimension value of
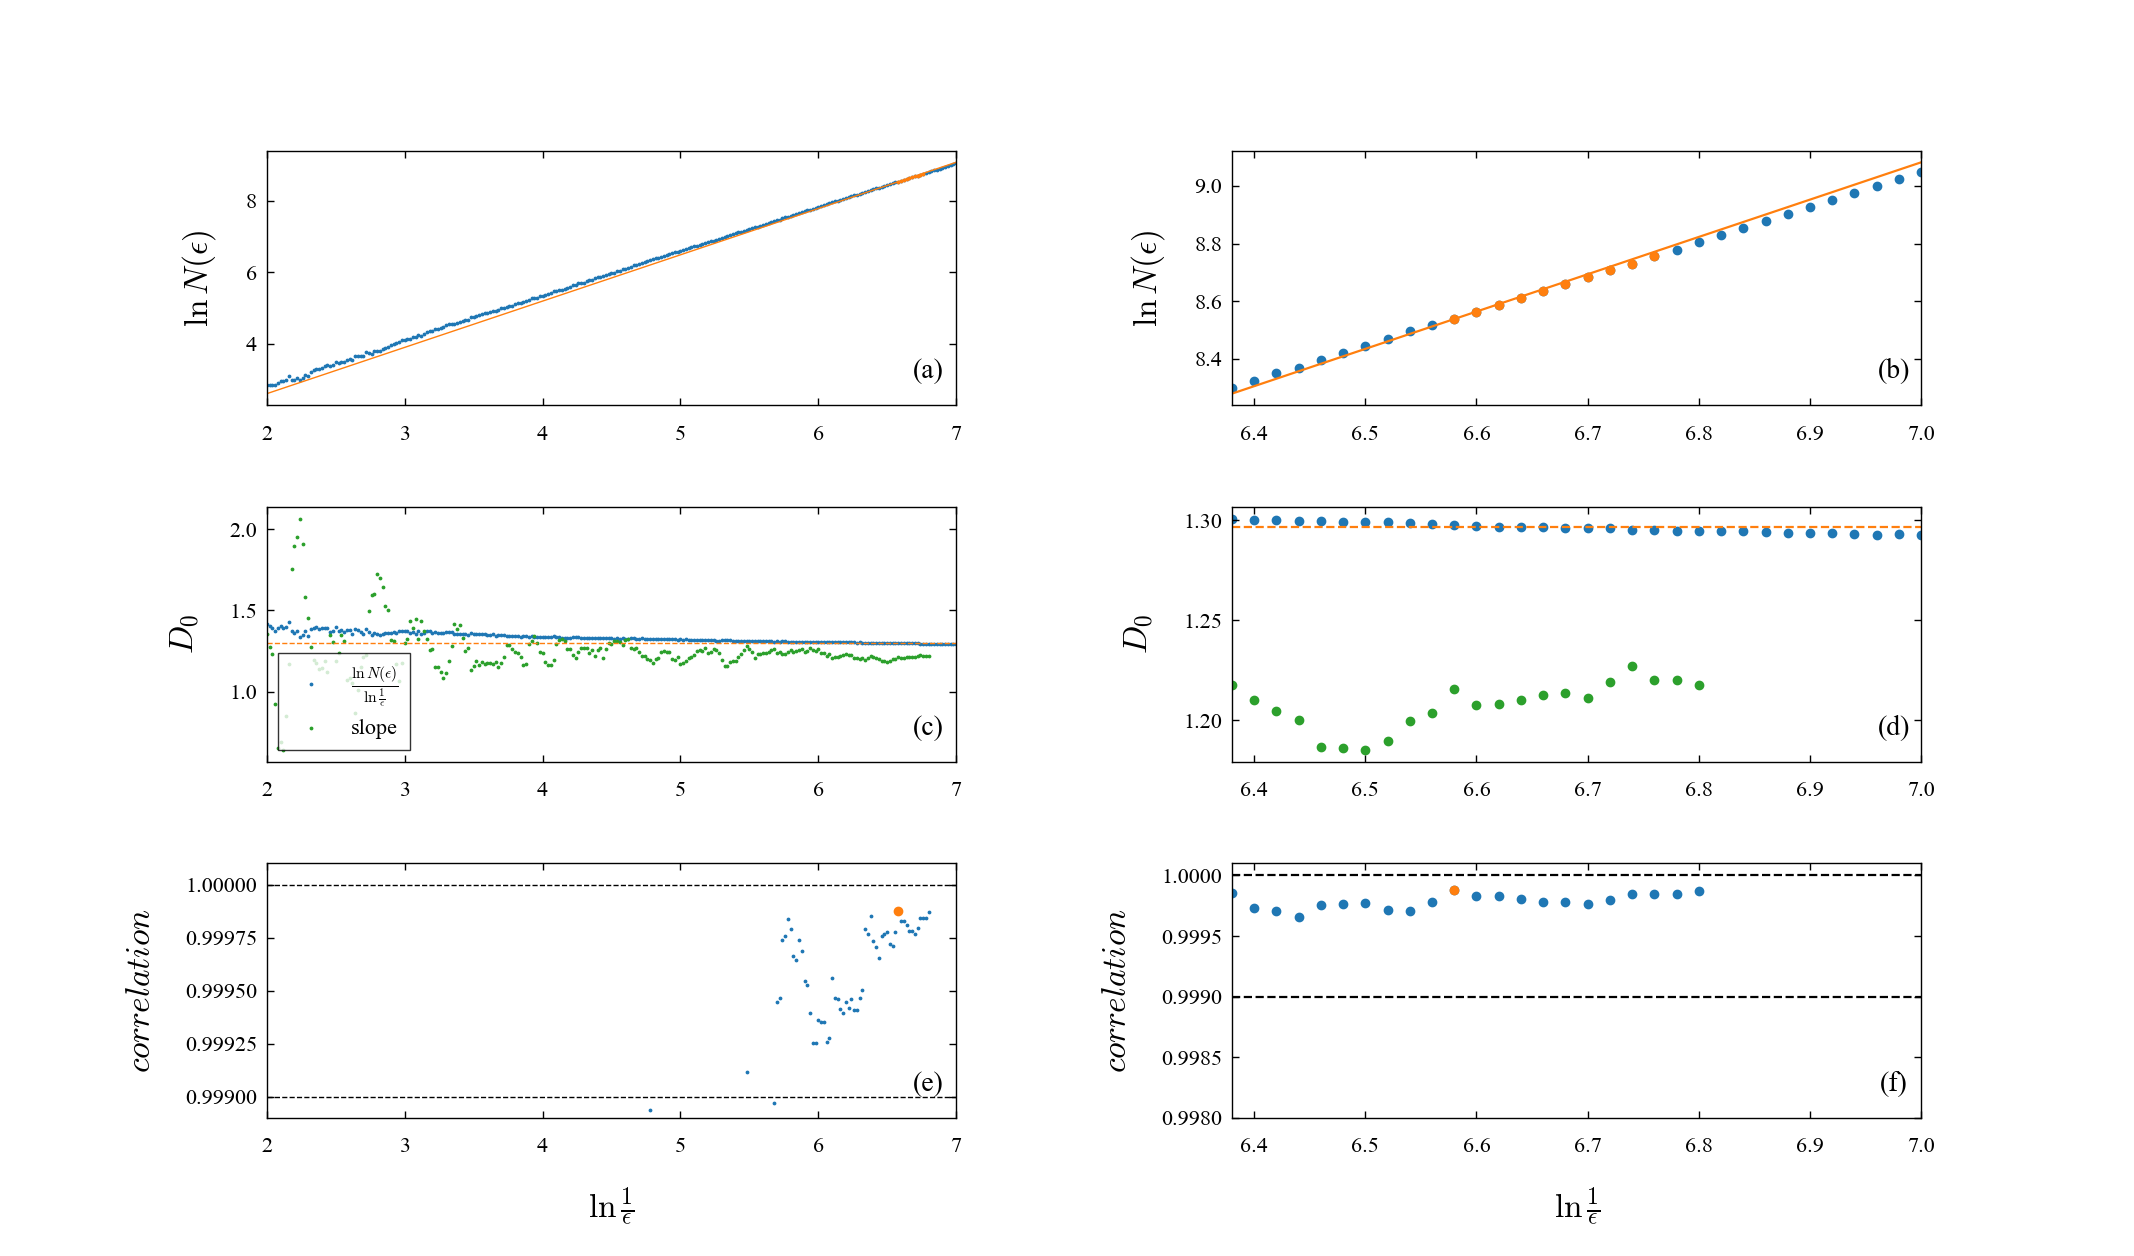
d=2.05±0.01 for the Lorenz attractor with (sigma, rho, beta)=(10, 28, 8/3). Ideally, my goal is to generate a figure akin to the one attached. I find it perplexing that most packages, despite claims of this capability, seldom demonstrate this value in their documentation or examples. Could you provide any guidance or examples that successfully achieve this benchmark?
Thanks for your time,
Ricardo
The text was updated successfully, but these errors were encountered: