Goal of this project is provide high level overview about memory consumption of Linux process and record its progress in time. These tools don't provide deep view to heap usage like Gperftools or Heaptrack, but monitoring of complete Rss/Pss layout from "outside". Heap size may be just fraction of all used memory, especially when some library manage its memory by anonymous mappings (mmap) and don't use libc allocator.
memory-record tool reads /proc files periodically and store information about system memory
and memory regions of processes to SQLite database. Gathered recording may be analyzed manually
or by provided tools...
Used files:
/proc/meminfo- system wide memory statistics/proc/<PID>/statm- process memory overview/proc/<PID>/smaps- details about process memory regions/proc/<PID>/oom_adj, oom_score, oom_score_adj- process tunables for OOM killer
Note that Rss and Pss sizes obtained from smaps file may differ from Rss visible in status,
statm or getrusage syscall. As explained
on StackOverflow "Linux OS: smaps vs statm"
and LKML thread "why smaps Rss is different from statm",
this value is read from counters that may be outdated (performance optimisation)
and most likely compute Rss differently (TODO: explanation).
This tool records process memory with given period (milliseconds) and store measurement to database.
memory-record [OPTION]...

Options:
  -h,
  --help                   Display help and exits
  -v,
  --version                Display application version and exits
  -p <number>,
  --pid <number>           Pid of monitored process. May be defined multiple times. If not defined, all processes are monitored.
  --period <number>        Period of snapshot [ms], default 1000
  --database-file <string> Sqlite database file for storing recording. Default is measurement.db
  --proc <string>          Mount point of proc filesystem. Default is /proc
Tool will exit on SIGQUIT, SIGINT (Ctrl+C), SIGTERM or SIGHUP signal.
When you want to record memory on small system where installation of Qt would be problematic, it is possible to do it via sshfs (sftp-server is required on the remote device).
mkdir proc
sshfs -odirect_io  [email protected]:/proc $(pwd)/proc
memory-record --proc ./proc -p remote-PID --period period-msThis tool allow to load exactly one sample of smaps to database. It may be useful with custom script.
memory-load-smaps [OPTION]... smaps-file

Mandatory arguments:
  smaps-file               smaps file to be loaded to database

Options:
  -h,
  --help                   Display help and exits
  -v,
  --version                Display application version and exits
  -p <number>,
  --pid <number>           Pid of monitored process. Default is 1.
  --database-file <string> Sqlite database file for storing recording. Default is measurement.db
This tool select peak memory (Rss or Pss) usage in recording and prints summary.
# ./memory-peak -p 123 --database-file measurement.db --process-memory rss
peak measurement: 481
time:             2018-08-17T15:58:03.942

thread stacks:                                            128 Ki
heap:                                                       0 Ki
anonymous:                                            541 812 Ki

/SYSV00000000                                          41 432 Ki
/dev/shm/org.chromium.rV92cn                           37 640 Ki
/usr/lib/firefox/libxul.so                             34 180 Ki
/usr/lib/x86_64-linux-gnu/libXss.so.1.0.0              15 528 Ki
/dev/shm/org.chromium.ifl8ui                           12 996 Ki
/usr/lib/x86_64-linux-gnu/libpulse.so.0.20.2           11 384 Ki
/usr/lib/x86_64-linux-gnu/libavcodec.so.57.107.100     10 600 Ki
/dev/shm/org.chromium.BUMGU8                            9 172 Ki
/usr/lib/x86_64-linux-gnu/libjpeg.so.8.1.2              5 956 Ki
/usr/lib/firefox/libsoftokn3.so                         3 208 Ki
/usr/lib/x86_64-linux-gnu/libdbusmenu-glib.so.4.0.12    2 044 Ki
/usr/lib/firefox/libmozavutil.so                        1 072 Ki
/usr/lib/firefox/libnspr4.so                            1 064 Ki
/lib/x86_64-linux-gnu/libnss_files-2.27.so              1 048 Ki
/usr/lib/x86_64-linux-gnu/libx265.so.146                1 016 Ki
/lib/x86_64-linux-gnu/libc-2.27.so                        780 Ki
/dev/shm/org.chromium.HWi8uq                              716 Ki
/usr/lib/firefox/libmozsqlite3.so                         608 Ki
/usr/lib/x86_64-linux-gnu/libgtk-3.so.0.2200.30           476 Ki
/usr/lib/x86_64-linux-gnu/libstdc++.so.6.0.25             420 Ki

other mappings:                                         7 700 Ki

sum:                                                  740 980 Ki
Experiment tool that replay all measurements in database.
memory-replay [OPTION]...

Options:
  -h,
  --help                    Display help and exits
  -v,
  --version                 Display application version and exits
  --interval <number>       Step interval [ms]. Default is 1000
  -p <number>,
  --pid <number>            Pid of analyzed process. If not defined, system wide statistics are displayed.
  --process-id <number>     Internal process id (may be used in case that pid is not unique)
  --database-file <string>  Sqlite database file with recording. Default is measurement.db
  --process-memory <string> Type of process memory used for sorting.
        pss (default) - Proportional set size as sum of pss values from /proc/[pid]/smaps
        rss - Resident set size as sum of rss values from /proc/[pid]/smaps
        statm - Resident set size as provided in /proc/[pid]/statm
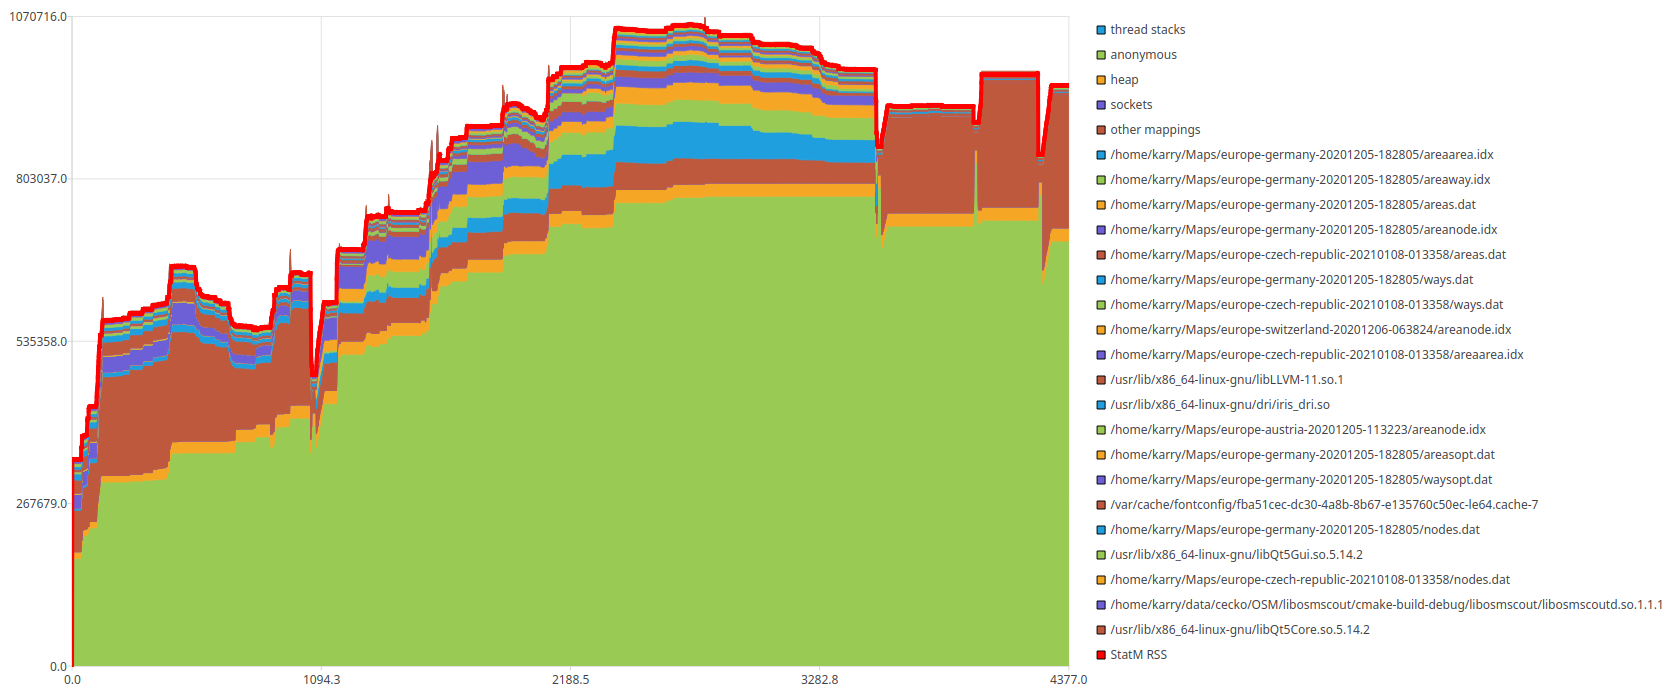
It shows you whole history in nice chart. Just be patient for loading :-)