How to calculate values for Box Plots
A box plot is a diagram that gives a visual representation to the distribution of the data, highlighting where most values lie and those values that greatly differ from the norm, called outliers.
The bottom side of the box represents the first quartile, and the top side, the third quartile. Therefore the vertical width of the central box represents the inter-quartile deviation. The horizontal line inside the box is the median. The vertical lines protruding from the box extend to the minimum and the maximum values of the data set, as long as these values are not outliers. The ends of the whiskers are marked by two shorter horizontal lines. Values higher than Q3+1.5xIQR or lower than Q1-1.5xIQR are considered outliers and are plotted above the top whisker or below the bottom whisker.
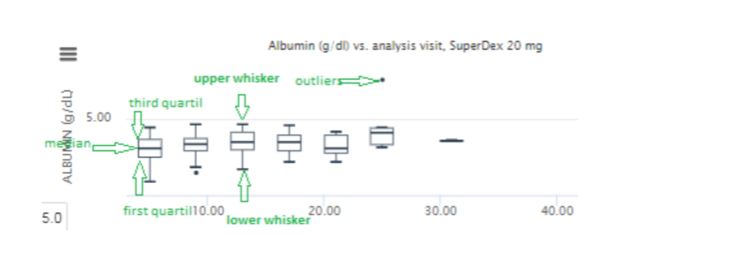
The interquartile range (IQR) is the difference between the third and the first quartiles. It is a measure of dispersion. The upper quartile (the third quartile or 75th percentile, xH (Q3)) is the value such that 75% of the observations are less than xH. The lower quartile (first quartile, or 25th percentile xL (also written as Q1)) is the number for which 25% of values in the data set are smaller than xL.
How quartiles are calculated To understand the concept of quartiles you need to arrange all the values in ascending order and divide it into four equal parts. The upper quartile is the part containing the highest data values, the lower quartile is the part containing the lowest data values. In other words, if we say 'this value is in the upper quartile', we mean that this value is in the top 25% of all values in this dataset. In ACUITY Upper quartile and Lower quartile are simply the 75% and 25% quartiles of the distribution. They do not account for discrete values. But for whisker calculation we use Tukey's method for finding the quartiles values:
- Arrange values in ascending order
- Calculate the total number of data ('n')
- For index of Upper quartile use formula (3*n+3)/4
- For index of Lower quartile use formula (n+3)/4.
- IQR is inquartile range calculated as Q3-Q1.
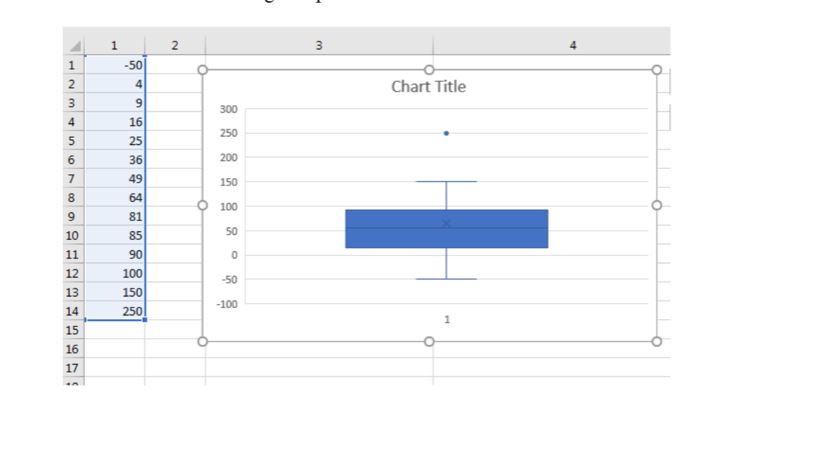
It is useful to use excel QUARTILE function to compare the data For example, if we have the data set {-50, 4, 9, 16, 25, 36, 49, 64, 81, 85, 90, 100, 150, 250}, number of data is 13 Lower quartile is 18.25.
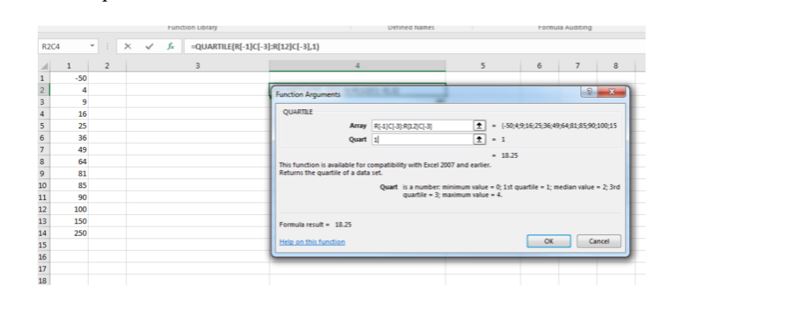
Upper quartile is 88.75.
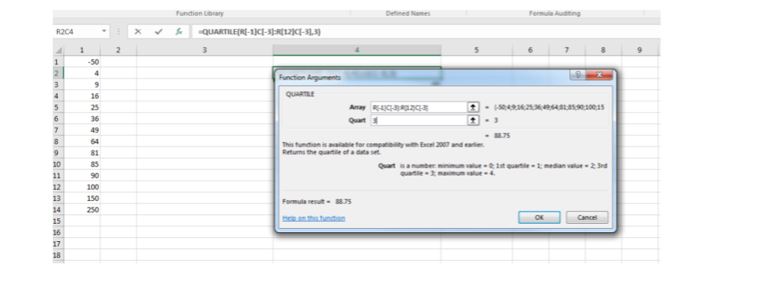
IQR = 88.75-18.25 = 70.5 When we know the quartiles, we can calculate Lower and Upper whiskers using the following logic:
- If (upper quartile + 1.5*IQR) > max(result) then upper whisker = max(result)
- If (upper quartile + 1.5*IQR) <= max(result) then upper whisker = max(result that is less than (upper quartile + 1.5IQR))
- If (lower quartile - 1.5*IQR) < min(result) then lower whisker = min(result)
- If (lower quartile - 1.5*IQR) >= min(result) then lower whisker = min(result that is greater than (lower quartile - 1.5IQR))
- Any values that fall outside of the whiskers are outliers Wiskers: Q3+1.5xIQR = 88.75+105.75 = 194.5 Q1-1.5xIQR = 18.25 - 105.75 = -87.5 So, 250 is outlier
So we have the following box plot: